|
Questions? E-mail us
or call us 302-584-1771, 8AM to 10PM U.S. East Coast Time 7 days a week
|
Cluster Stacked Column Chart Creator
|
Screen shots: 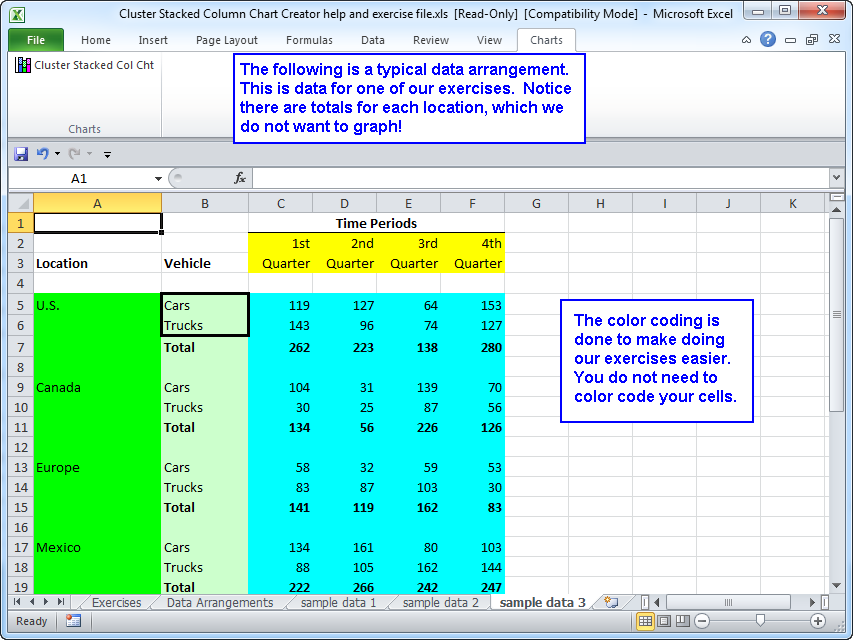 |
The Cluster Stacked Column Chart Creator add-in for Microsoft Excel makes creating such charts very easy. It is compatible with Microsoft Excel 2013-2024 and Office 365.
The following is an example of a cluster stacked column chart:
The data arrangement needed to create such a chart is very simple. The following illustrates the data for the above chart:
) |
) |
The entire process is menu driven.
One of the key features of the Cluster Stacked Column Chart Creator is it can create different data layouts, each of which can be used to create a different cluster stacked column chart view. In the chart illustration at the top the data arrangement and chart view is:
| Cluster: | Quarters in a year |
| Columns: | Sales Regions |
| Stack: | Type of vehicles |
However, there are actually six data arrangements one can have with the above data:
| Chart Components |
Possible chart arrangements | |||||||
1 |
2 |
3 |
4 |
5 |
6 |
|||
| Cluster: | Quarters in a year | Quarters in a year | Sales Regions | Sales Regions | Type of vehicles | Type of vehicles | ||
| Columns: | Sales Regions | Type of vehicles | Quarters in a year | Type of vehicles | Sales Regions | Quarters in a year | ||
| Stack: | Type of vehicles | Sales Regions | Type of vehicles | Quarters in a year | Quarters in a year | Sales Regions | ||
In order to create a cluster stacked column chart of arrangements 2-6, one normally would have to manually re-arrange the data, which is painful. However, the Cluster Stacked Column Chart Creator can easily create the different data arrangements. And then one can use the Cluster Stacked Column Chart Creator to graph them. So, in just a few minutes of use, one gets six cluster stacked charts, not just one.
Order online from our secure service. |
|
US $29.95 |
Customers who viewed the Cluster Stacked Column Chart Creator also viewed:
- Productivity Suite - Contains all of our add-ins including the Compare Columns Assistant. Save $$
| Copyright 2026 Add-ins.com LLC, all rights reserved. Spreadsheet Assistant is a registered trademark of Add-ins.com LLC. |