 |
|
Questions? E-mail us
or call us 302-584-1771, 8AM to 10PM U.S. East Coast Time 7 days a week
|
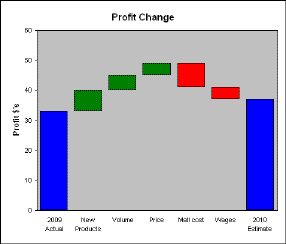
Waterfall charts are used to explain changes in performance. A typical use is to explain the change in earnings from one year to the next. One can use for many other uses. For example explaining how operating costs changed from one time period to a next. Or to compare two competitors with the floating bars representing differences. All of the examples below were created using the Waterfall Chart Creator.
The following illustrates a typical simple waterfall chart:

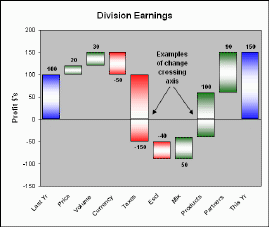
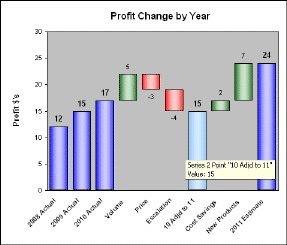
Waterfall charts can be far more complex, with multiple total columns and with values that cross the zero axis. The following illustrate such charts. The first waterfall chart illustrates positive and negative change crossing the zero axis. The second illustrates multiple total columns and a subtotal column.
 |
 |
All of the above charts were created with the Waterfall Chart Creator. - Download a trial version now!
View more waterfall chart examples.
Waterfall charts are actually a special type of Excel column chart. A typical waterfall chart uses the the first and last columns to represent total values. The intermediate columns appear to float, and represent positive or negative change from one period to another, ending up with the final total value. The floating columns in a waterfall chart are created by using hidden columns. Creating waterfall chart is fairly difficult as special data tables must be constructed. If you do manually, it takes a fair amount of time and is very subject to error. The following illustrates a typical data table:
| A | B | C | D | E | F | G | H | I | |
| 1 | Above | Below | Above | Below | |||||
| 2 | zero axis | zero axis | zero axis | zero axis | Floating | ||||
| 3 | X Axis | Hidden | Total | Pos. Chg | Pos. Chg | Neg. Chg | Neg. Chg | Zero | |
| 4 | Labels | Column | Columns | Points | Points | Points | Points | axis | Totals |
| 5 | Last Yr | 0 | 100 | 0 | 0 | 0 | 0 | 0 | 100 |
| 6 | Price | 100 | 0 | 20 | 0 | 0 | 0 | 0 | 20 |
| 7 | Volume | 120 | 0 | 30 | 0 | 0 | 0 | 0 | 30 |
| 8 | Currency | 100 | 0 | 0 | 0 | 50 | 0 | 0 | -50 |
| 9 | Taxes | 0 | 0 | 0 | 0 | 100 | -50 | 0 | -150 |
| 10 | Escl | -50 | 0 | 0 | 0 | -40 | 0 | 0 | -40 |
| 11 | Mix | -40 | 0 | -50 | 0 | 0 | 0 | 0 | 50 |
| 12 | Products | 0 | 0 | -40 | 60 | 0 | 0 | 0 | 100 |
| 13 | Partners | 60 | 0 | 90 | 0 | 0 | 0 | 0 | 90 |
| 14 | This Yr | 0 | 150 | 0 | 0 | 0 | 0 | 0 | 150 |
Each time your waterfall data changes, tables like the above have to be updated. Formulas to do the calculations are extremely complex to write. The Waterfall Chart Creator is designed to create and update such tables and avoid manual error.
| Copyright 2025 Add-ins.com LLC, all rights reserved. Spreadsheet Assistant is a registered trademark of Add-ins.com LLC. |